
.jpg)

Analyze, model, and uncover insights

Collect, clean, and structure data
Communicate insights clearly
Transform raw data into meaningful insights with the power of data visualization. This video explores how visual storytelling can help you make better decisions, spot trends, and communicate complex information with ease. Watch now to see how data visualization can elevate your understanding and impact!
See More Example Dashboards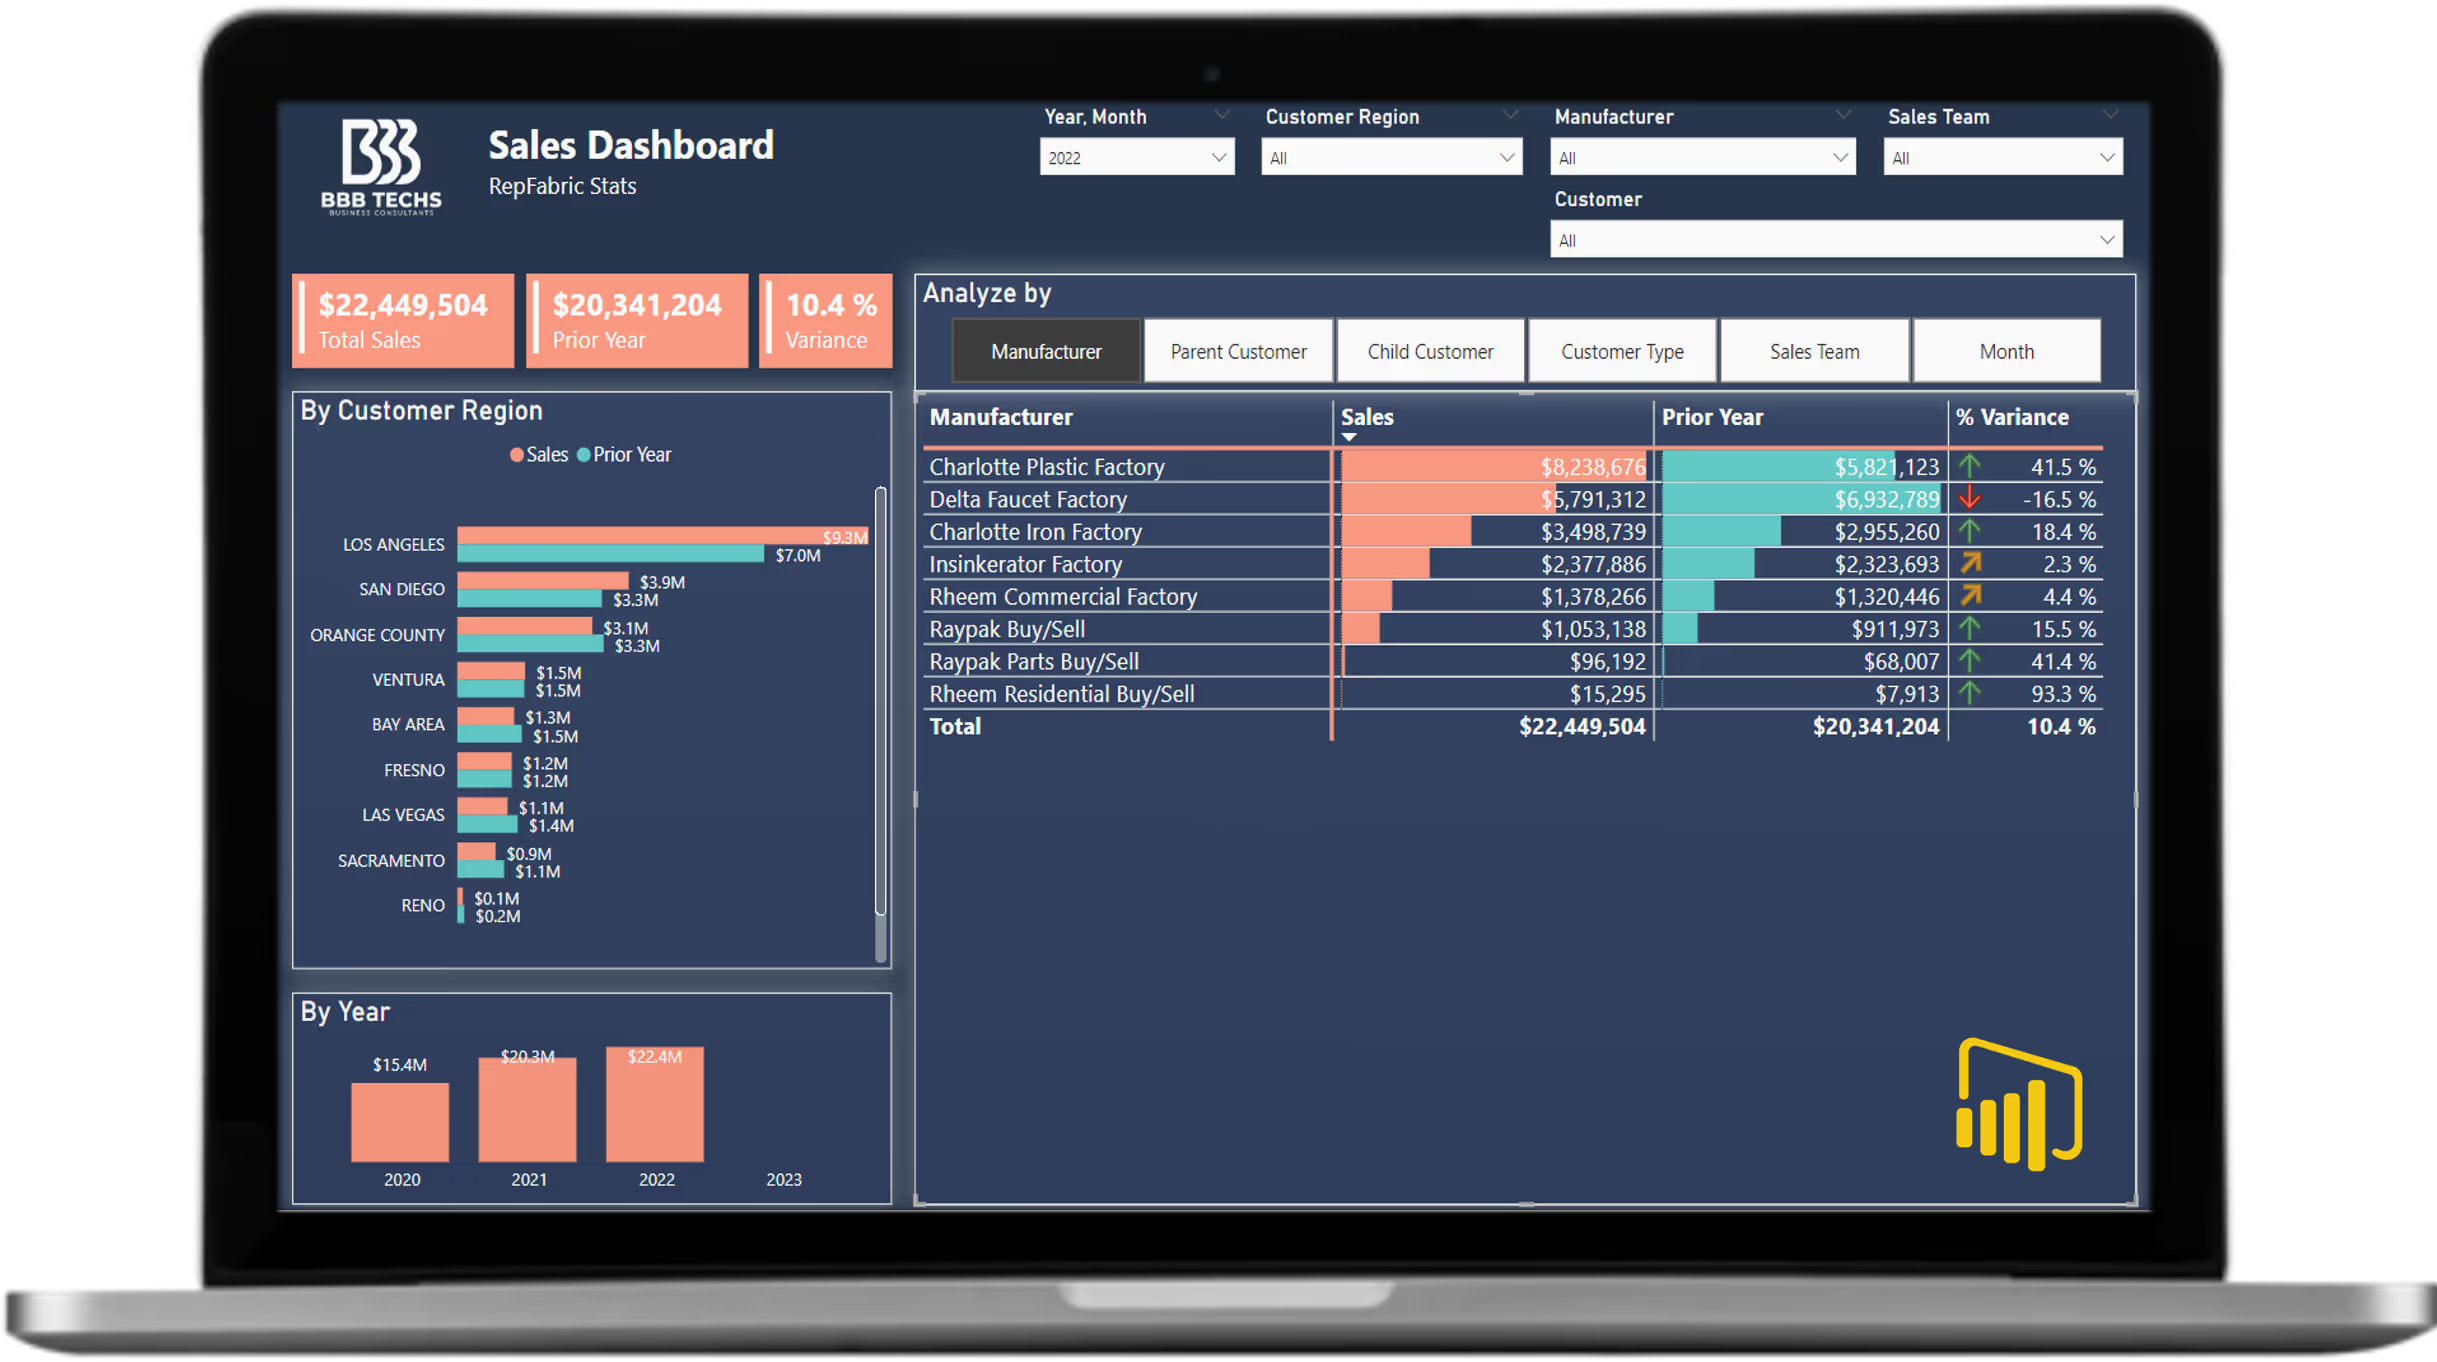
Data visualization can benefit business in any industry. Use it to to streamline your own business or use it to find opportunities for success in various markets.


*Leverage our tiered pricing with an upfront payment gaining discounted rates and direct access to our experts, or select A La Carte pricing for flexible, project-based billing—both designed to meet your specific service needs. For more information, click here.


If you're ready to get started or just have some questions, reach out! We'd love to chat with you and see how we can help.